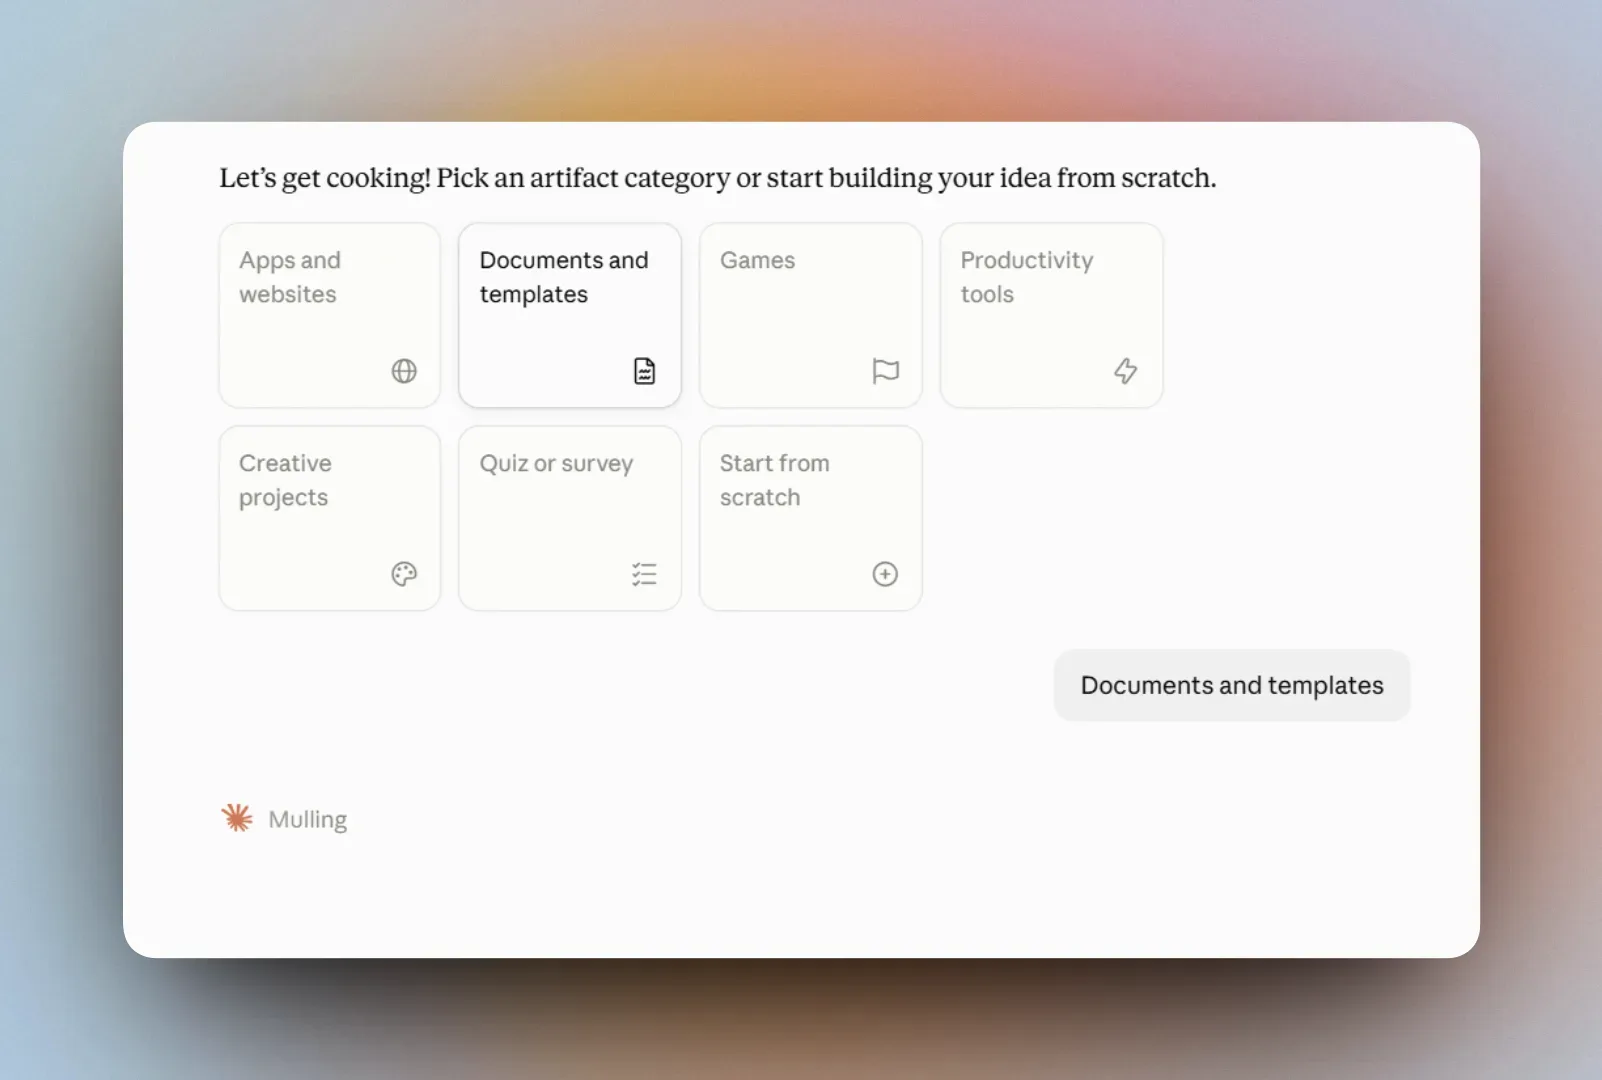
Claude Artifacts are documents, visualisations and interactive tools shown in a window of their own beside the conversation, which Claude can build from your description. Put simply, Claude does not only explain how to do something — it can build a result immediately, and you can review it, test it and go on improving it.
For example, you can build:
- a document – a plan, a report, a set of instructions or other structured content;
- a data visualisation – a chart or a simple management dashboard;
- an interactive calculator – for a price, a budget or another figure;
- a website prototype – a first version of a page or of one part of it;
- a diagram – to explain a process, a structure or a sequence of steps;
- a simple application – a task board, a quiz, a planning tool or another interactive answer.
You do not need to write code to build an artifact. Describe the result you want and ask plainly: “Build this as a Claude Artifact.” You can then carry on the conversation with Claude and ask it to change the content, the design or the functions.
How to build an artifact
- Open Claude and start a new conversation.
- Describe what you want to build — a calculator, a management dashboard, a diagram, a document or a simple application, for example.
- State what information, functions and design it has to hold.
- Ask plainly: “Build this as a Claude Artifact.”
- Claude builds the artifact and opens it in a window of its own beside the conversation.
- Review the result and test it. In the conversation, write what you want to change, add or remove.
- You can copy, download, publish and share the finished artifact.
You can go on improving the artifact in the same conversation. You do not have to describe the whole result again — name the one change you want, for example “Add a month selector”, “Change the colours” or “Show the total with VAT”.
What can you build in practice?
Below are a few simple artifact examples you can try immediately.
Sign in to read and copy this prompt.
Sign inYou enter the tasks, the hours and the rate, and the total price is calculated for you.
Sign in to read and copy this prompt.
Sign inThe company’s main figures on one screen.
Sign in to read and copy this prompt.
Sign inYou see the tasks, their status, the people responsible and the deadlines.
Official sources
This guide follows Anthropic’s own documentation. It carries the newest and fullest version of everything below: